
Troubleshooting Pipeline Failures: Debugging Jenkins and Git Issues

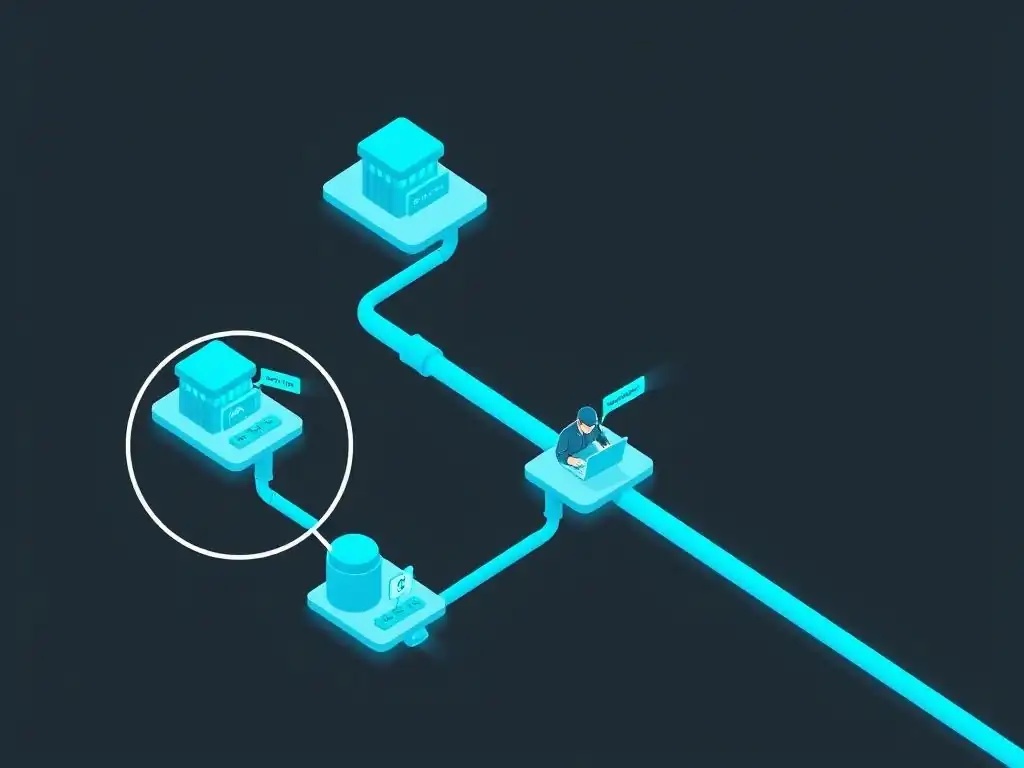
Welcome to Git and Version Control Hub!
Ever been stumped by a failing Jenkins pipeline connected to your Git repository? Dive into our guide on debugging Jenkins Git pipeline issues and unlock the secrets to smoother, more reliable automated workflows. Discover effective troubleshooting techniques and practical solutions to get your CI/CD back on track. Ready to conquer those pipeline headaches? Let's get started!
Troubleshooting Pipeline Failures: Debugging Jenkins and Git Issues
- Introduction: Identifying and Resolving Jenkins Git Pipeline Problems
- Understanding Common Causes of Jenkins Git Pipeline Failures
- Debugging Techniques for Jenkins Git Pipeline Errors
- Specific Git Related Issues and Solutions in Jenkins Pipelines
- Addressing Common Jenkins Pipeline Issues
- Best Practices for Preventing Jenkins and Git Pipeline Failures
-
Advanced Debugging Strategies for Complex Jenkins Git Pipelines
- Using Jenkins Declarative Pipelines for Easier Debugging
- Leveraging Jenkins Shared Libraries for Reusable Code and Debugging
- Integrating Static Code Analysis Tools for Early Error Detection
- Using retry step with exponential backoff for transient errors
- Implementing Pipeline Visualization Tools for Complex Workflows
- Case Studies: Real-World Jenkins Git Pipeline Debugging Scenarios
- Conclusion: Mastering Jenkins and Git Pipeline Debugging
-
Frequently Asked Questions
- What are some common causes of Jenkins Git pipeline failures?
- How can I check the Jenkins console output for clues about pipeline failures?
- What role does Git authentication play in potential pipeline failures?
- What are some strategies for debugging Git commands within a Jenkins pipeline?
- How can I ensure my Jenkins pipeline is integrated correctly with GitHub or GitLab?
- Final Reflection: Mastering Pipeline Resilience
- Conquer Your Code: Master Git and Jenkins!
Introduction: Identifying and Resolving Jenkins Git Pipeline Problems
Jenkins pipelines, orchestrated with Git for version control, are the backbone of modern software delivery. They automate build, test, and deployment processes, ensuring efficiency and consistency. However, these pipelines are complex systems, and failures are inevitable.
Identifying and resolving these failures quickly is crucial for maintaining development velocity and ensuring timely software releases. This article delves into the common causes of Jenkins Git pipeline failures, explores effective debugging techniques, and provides practical solutions to get your pipelines back on track. We will cover a range of issues, from simple configuration errors to intricate scripting problems and Git integration challenges, equipping you with the knowledge to troubleshoot and prevent future pipeline disruptions.
Understanding Common Causes of Jenkins Git Pipeline Failures
Jenkins Git pipeline failures can stem from various sources, often intertwined and requiring a systematic approach to diagnose. Understanding the common pitfalls is the first step towards efficient troubleshooting. These failures frequently arise from misconfigurations within Jenkins, issues with Git repository access, problems in the build environment, errors in the pipeline scripting, or network connectivity disruptions. Each of these areas presents a unique set of challenges, and a comprehensive understanding of these potential failure points is essential for effectively debugging Jenkins Git pipelines.
Configuration Errors in Jenkins Pipelines
Pipeline configuration errors are a frequent source of issues, often arising from incorrect syntax in the Jenkinsfile or misconfigured pipeline parameters. For instance, a simple typo in a stage name or an improperly defined environment variable can halt the pipeline execution. Consider a scenario where a stage is defined as stage('Bulid') instead of stage('Build'). Jenkins, being case-sensitive, will fail to recognize this stage, leading to a pipeline failure. Similarly, if a necessary tool path is incorrectly specified in the PATH environment variable within the Jenkinsfile, build steps relying on that tool will fail. Careful review and validation of the Jenkinsfile syntax and configuration parameters are crucial first steps in debugging pipeline failures.
Another common configuration error lies in the incorrect setup of Jenkins agents or nodes. If a pipeline is designed to run on a specific agent with particular tools and dependencies, but the agent is not properly configured or labeled in Jenkins, the pipeline may fail to execute on the intended environment. For example, a pipeline designed to build a Java application might be configured to run on an agent labeled 'java-builder'.
If no agent with this label is connected or if the 'java-builder' agent lacks the necessary JDK installation, the pipeline will fail. Ensuring that agents are correctly configured, labeled, and possess the required software and dependencies is vital for preventing configuration-related pipeline failures.
Git Repository Access Issues and Authentication Problems
Git repository access issues are a prevalent category of failures in Jenkins Git pipelines, particularly concerning authentication and authorization. Pipelines often need to clone repositories to access source code, and if Jenkins lacks the correct credentials or permissions to access the Git repository, the pipeline will fail at the very first step.
A common scenario involves using SSH keys for authentication. If the SSH private key configured in Jenkins does not match the public key authorized for the Git repository, or if the passphrase for the private key is incorrect, Jenkins will be unable to clone the repository, resulting in a "Git clone failed" error.
Furthermore, access control configurations on the Git repository itself can lead to pipeline failures. Even with correct credentials configured in Jenkins, if the Jenkins user or service account lacks the necessary read or clone permissions on the repository, the pipeline will be denied access.
For instance, if a repository is set to private and the Jenkins credentials are not associated with a user or service account that has been explicitly granted access to the repository, the clone operation will fail. Verifying repository permissions and ensuring that the Jenkins credentials are appropriately authorized to access the Git repository are critical steps in troubleshooting Git access related pipeline failures.
Build Environment Issues and Dependency Conflicts
Build environment issues and dependency conflicts are frequent culprits behind Jenkins pipeline failures, especially in complex projects with numerous dependencies. Pipelines rely on a consistent and correctly configured build environment, and discrepancies or conflicts within this environment can lead to unpredictable failures. A common problem is missing or incorrect versions of dependencies. For example, a Java project might require a specific version of Maven or Gradle for building. If the Jenkins agent lacks this specific version or if the PATH environment variable points to an incompatible version, the build process will likely fail with dependency resolution errors.
Dependency conflicts, particularly in languages like Python or JavaScript where dependency management is crucial, can also cause pipeline failures. If different parts of the project or different pipeline stages require conflicting versions of the same library, the build process might encounter runtime errors or unexpected behavior. Consider a scenario where one stage requires library 'A' version 1.0 and another stage, due to a transitive dependency, inadvertently installs library 'A' version 2.0, which introduces breaking changes.
This conflict can lead to pipeline failures that are difficult to diagnose without carefully examining the dependency resolution process and the build environment. Ensuring consistent and compatible dependency versions across the entire pipeline execution environment is crucial to avoid these issues.
Scripting Errors in Jenkins Pipeline Groovy Code
Scripting errors within the Jenkins Pipeline Groovy code are a common source of failures, especially as pipelines become more complex and involve custom logic. Groovy, while powerful, is a programming language, and errors in the script syntax, logic, or handling of data can lead to pipeline disruptions.
A simple syntax error, such as a missing semicolon or an incorrect variable name within a Groovy script block, can cause the Jenkins pipeline parser to fail, preventing the pipeline from even starting execution. These syntax errors are usually caught early in the pipeline execution and are relatively straightforward to debug by carefully reviewing the script and checking for syntax correctness.
Logical errors in the Groovy code, on the other hand, can be more subtle and challenging to debug. These errors might not cause immediate pipeline failure but can lead to unexpected behavior or incorrect results later in the pipeline.
For instance, an incorrect conditional statement or a flaw in the algorithm implemented within the Groovy script might lead to a stage being skipped unintentionally or incorrect data being processed. Debugging these logical errors often requires a thorough understanding of the pipeline logic, careful examination of variable values at different stages of execution, and potentially the use of debugging tools to step through the Groovy code and identify the point where the logic deviates from the intended behavior.
Network Connectivity Problems Affecting Git and Jenkins
Network connectivity problems can significantly disrupt Jenkins Git pipelines, as pipelines rely on network communication for various operations, including fetching code from Git repositories, communicating with build agents, and interacting with external services. Issues with network connectivity can manifest in various forms, such as inability to reach the Git repository server, agent disconnections, or timeouts during network operations.
For example, if the Jenkins server or a build agent is behind a firewall and the firewall rules are not correctly configured to allow outbound connections to the Git repository server on the necessary ports (typically SSH port 22 or HTTPS port 443), Git clone operations will fail due to network connectivity issues.
Intermittent network problems can be particularly challenging to diagnose. These problems might cause sporadic pipeline failures that are difficult to reproduce consistently. For instance, temporary network congestion or DNS resolution issues can lead to transient Git clone failures or agent disconnections. In such cases, monitoring network latency and packet loss, checking DNS resolution configurations, and examining network logs can help identify intermittent network connectivity problems that are affecting Jenkins Git pipelines. Ensuring stable and reliable network connectivity between Jenkins, Git repositories, build agents, and any external services is crucial for pipeline stability.
Debugging Techniques for Jenkins Git Pipeline Errors
Debugging Jenkins Git pipeline errors effectively requires a systematic approach and the utilization of various debugging techniques. These techniques range from simple log analysis to more advanced debugging tools and strategies embedded within the pipeline itself. Mastering these techniques empowers developers to quickly pinpoint the root cause of pipeline failures and implement effective solutions, minimizing downtime and maintaining development velocity.
Examining Jenkins Console Output for Error Messages
The Jenkins console output is the primary source of information for debugging pipeline failures. It provides a detailed log of the pipeline execution, including all commands executed, their output, and any error messages generated. When a pipeline fails, the first step in debugging should always be to carefully examine the console output. Error messages are often prominently displayed in red text and provide valuable clues about the nature of the failure. For example, a "Git clone failed" error message clearly indicates an issue with the Git repository cloning process, prompting further investigation into Git repository access or authentication.
Beyond explicit error messages, the console output also contains valuable contextual information. By examining the sequence of commands executed leading up to the failure, developers can often pinpoint the exact stage or step where the problem occurred. For instance, if a build step fails, the console output will typically show the command that was executed, the environment variables in effect, and the standard output and standard error streams generated by the command.
Analyzing this information can reveal issues such as missing dependencies, incorrect command syntax, or problems with the build environment configuration. Therefore, a thorough review of the Jenkins console output is an indispensable first step in debugging any pipeline failure.
Analyzing Git Logs for Commit and Branching Issues
Analyzing Git logs becomes crucial when debugging pipeline failures that seem related to Git operations, such as incorrect branch checks, unexpected merge conflicts, or issues with commit history. Jenkins pipelines interact heavily with Git, and discrepancies between the expected Git state and the actual state can lead to pipeline failures.
For instance, if a pipeline is designed to build and deploy code from a specific Git branch, but due to an error in the pipeline script or an unexpected Git operation, the pipeline ends up checking out a different branch, the resulting build might be based on the wrong codebase and lead to failures.
Git logs provide a detailed history of all Git operations performed within the pipeline, including commits, branch changes, merges, and tags. By examining the Git logs, developers can verify that the pipeline is interacting with the Git repository as intended. For example, they can check if the correct branch was checked out, if the expected commits were included, or if any unexpected merges occurred. Commands like git log, git reflog, and git branch -v executed within the pipeline can provide valuable insights into the Git state and help identify discrepancies that might be causing pipeline failures related to Git branching, merging, or commit history.
Using Debugging Tools in the Jenkins Pipeline
Jenkins offers several debugging tools that can be integrated directly into the pipeline to aid in troubleshooting complex issues. These tools allow for more interactive and detailed debugging compared to simply examining console output and logs. One powerful debugging technique is using the script step with println statements to output variable values and script execution flow at various points in the pipeline. Strategically placed println statements can help track the values of variables, verify the execution path of conditional statements, and understand the overall flow of the pipeline script. This approach is particularly useful for debugging complex Groovy scripts within the pipeline.
For more advanced debugging, Jenkins supports remote debugging of Groovy scripts. This allows developers to connect a debugger, such as IntelliJ IDEA or Eclipse, to the Jenkins agent executing the pipeline and step through the Groovy code line by line, inspect variable values, and set breakpoints. Remote debugging provides a much more interactive and in-depth debugging experience compared to log-based debugging and is invaluable for troubleshooting complex logical errors or performance issues within the pipeline script. Setting up remote debugging typically involves enabling debugging ports on the Jenkins agent and configuring the debugger to connect to that port.
Implementing Error Handling and Logging in Pipeline Scripts
Implementing robust error handling and logging within Jenkins pipeline scripts is crucial for proactive debugging and preventing minor issues from escalating into major pipeline failures. Well-designed error handling ensures that pipelines can gracefully handle unexpected situations, provide informative error messages, and potentially recover from transient errors. Using try-catch blocks in Groovy scripts allows for catching exceptions that might occur during pipeline execution. Within the catch block, developers can log detailed error information, perform cleanup actions, and potentially attempt to retry the failing step or stage.
Comprehensive logging is equally important for debugging. Beyond basic console output, pipelines should be configured to generate detailed logs that capture relevant information about the pipeline execution, including timestamps, variable values, important events, and error details. These logs can be stored externally, for example, in a dedicated logging system or a file storage, for later analysis.
Effective logging helps in post-mortem debugging of pipeline failures, allowing developers to reconstruct the sequence of events leading up to the failure and identify the root cause even after the pipeline execution has completed. Combining robust error handling with comprehensive logging significantly enhances the debuggability and resilience of Jenkins Git pipelines.
Jenkins pipelines, deeply integrated with Git, can encounter a range of Git-specific issues. These issues often revolve around Git clone operations, merge conflicts, branching and tagging, and submodule handling. Understanding these common Git-related problems and their solutions is essential for maintaining smooth and efficient pipelines.
Resolving Git Clone Failures in Jenkins
Git clone failures are a common initial hurdle in Jenkins pipelines, typically stemming from authentication problems, repository access issues, or network connectivity problems. When a "Git clone failed" error occurs, the first step is to verify the Git repository URL configured in the Jenkins pipeline. Ensure that the URL is correct, accessible, and uses the appropriate protocol (e.g., HTTPS or SSH). For HTTPS URLs, confirm that the Jenkins credentials (username and password or personal access token) are correctly configured and valid for accessing the repository.
For SSH-based Git clone operations, the most frequent cause of failure is incorrect SSH key configuration. Verify that the SSH private key configured in Jenkins matches the public key authorized for the Git repository. Ensure that the passphrase for the SSH private key, if any, is correctly entered in Jenkins. Furthermore, check the permissions of the SSH private key file on the Jenkins server or agent to ensure that Jenkins has read access to the key. If network connectivity is suspected, test network reachability to the Git repository server from the Jenkins server or agent using tools like ping or traceroute. Firewall rules or network configurations might be blocking access to the Git repository port (port 22 for SSH, port 443 for HTTPS). Addressing these authentication, access, and network issues typically resolves most Git clone failures in Jenkins pipelines.
Handling Git Merge Conflicts During Pipeline Execution
Git merge conflicts can arise during pipeline execution, particularly in scenarios involving automated merging of branches or when multiple developers are concurrently working on the same codebase. When a merge conflict occurs, the pipeline will typically pause or fail, requiring manual intervention to resolve the conflict. Jenkins provides mechanisms to handle merge conflicts, but proactive strategies are often more effective.
One approach is to implement pre-merge checks within the pipeline. Before attempting a merge, the pipeline can perform checks to detect potential conflicts, such as comparing the branches to be merged or running static analysis tools to identify code changes that might lead to conflicts.
If a merge conflict does occur during pipeline execution, the pipeline should ideally halt and provide clear instructions on how to resolve the conflict. The console output should indicate the files with conflicts and the branches involved. Developers can then manually clone the repository, resolve the conflicts locally using Git merge tools, and commit the resolved changes.
Once the conflicts are resolved and committed to the target branch, the pipeline can be manually restarted or configured to automatically resume upon detecting changes in the target branch. For fully automated pipelines, more sophisticated conflict resolution strategies, such as using Git's merge strategies or implementing custom conflict resolution logic in the pipeline script, might be necessary.
Debugging Git Branching and Tagging Issues in Jenkins
Git branching and tagging operations are integral to many Jenkins pipelines, but errors in these operations can lead to pipeline failures or unexpected behavior. Common issues include attempting to create branches or tags that already exist, incorrect branch or tag names, or problems with branch deletion or tag pushing permissions. When debugging branching or tagging issues, carefully examine the Jenkins console output for specific error messages related to Git branch or tag commands. For example, an error message like "fatal: A branch named 'feature/new-feature' already exists" indicates an attempt to create a branch that already exists.
To debug branching issues, verify the branch names used in the pipeline script and ensure they are correct and intended. Use Git commands like git branch -a within the pipeline to list all existing branches and confirm the current branch. For tagging issues, check tag names, and use git tag -l to list existing tags. Verify that the Jenkins user or service account has the necessary permissions to create branches and tags in the Git repository. In some Git hosting platforms, branch and tag creation permissions might be restricted to specific users or roles. Ensuring correct branch and tag names, verifying existing branches and tags, and checking permissions are crucial steps in debugging Git branching and tagging issues in Jenkins pipelines.
Fixing Git Submodule Problems in Jenkins Pipelines
Git submodules, used to include external repositories within a main repository, can introduce complexities in Jenkins pipelines and are often a source of pipeline failures if not handled correctly. A common issue is that Jenkins pipelines, by default, might not automatically initialize and update Git submodules during the clone operation. This can lead to build failures if the project relies on code or resources located in submodules. To resolve this, ensure that the Jenkins pipeline configuration or script explicitly initializes and updates submodules after cloning the main repository. This can be achieved by adding a step in the pipeline script that executes the command git submodule update --init --recursive. The --recursive flag is important to initialize and update nested submodules as well.
Another potential problem with submodules is related to SSH key forwarding or credential handling. If submodules are hosted in private repositories that require authentication different from the main repository, Jenkins might not be able to access them without proper credential configuration. In such cases, ensure that Jenkins has the necessary credentials (e.g., SSH keys) to access the submodule repositories.
SSH key forwarding might be required if the submodules are accessed via SSH and the credentials are managed at the Jenkins server level. Carefully configure submodule initialization and update steps in the pipeline and address any credential or authentication requirements for submodule repositories to avoid Git submodule related pipeline failures.
Addressing Common Jenkins Pipeline Issues
Beyond Git-specific problems, Jenkins pipelines can encounter a range of general issues related to the Jenkins environment itself, build process failures, agent connectivity, plugin conflicts, and resource management. Addressing these common Jenkins pipeline issues is crucial for maintaining a stable and reliable CI/CD system.
Troubleshooting Jenkins Build Failures
Jenkins build failures encompass a broad spectrum of issues that occur during the build stage of a pipeline. These failures can range from compilation errors in compiled languages like Java or C++, to test failures in unit or integration tests, to errors during packaging or artifact creation. When a build failure occurs, the first step is to meticulously examine the Jenkins console output for detailed error messages generated by the build tools (e.g., compiler, test runner, packaging tools).
Compilation errors will typically point to specific lines of code with syntax errors or type mismatches. Test failures will indicate which tests failed and often provide stack traces or error details to help pinpoint the cause of the failure.
Dependency resolution problems are another common cause of build failures. If the build process relies on external libraries or dependencies, and these dependencies are not available or cannot be resolved correctly, the build will fail. Check the build logs for dependency resolution errors and ensure that the build environment is correctly configured with the necessary dependency repositories or package managers. Environment variables and tool paths also play a critical role in build success. Incorrectly configured environment variables or tool paths can lead to build tool execution failures or unexpected behavior. Verify that all required environment variables are set correctly and that the PATH environment variable includes the directories containing the necessary build tools. Thoroughly analyzing build logs, dependency management, and environment configurations is essential for troubleshooting Jenkins build failures.
Diagnosing and Fixing Jenkins Agent Connectivity Issues
Jenkins agent connectivity issues can disrupt pipeline execution, especially in distributed Jenkins environments where pipelines are executed on remote agents. Agent connectivity problems can manifest as agents becoming offline, agent disconnections during pipeline execution, or inability of the Jenkins master to communicate with agents. When agent connectivity issues arise, first check the Jenkins agent status page in the Jenkins web UI.
This page provides information about the current status of each agent, including whether it is online or offline, and any error messages related to agent connectivity. If an agent is offline, investigate the agent logs on the agent machine itself. Agent logs typically contain details about connection attempts, errors, and any exceptions that might have occurred during agent startup or operation.
Network connectivity between the Jenkins master and agents is a fundamental requirement. Verify that there are no network connectivity problems between the master and agents. Use tools like ping or traceroute to test network reachability. Firewall rules on the master or agent machines, or network infrastructure firewalls, might be blocking communication between the master and agents. Ensure that firewall rules are configured to allow communication on the ports used by Jenkins agents (typically TCP port 22 for SSH agents or JNLP agent ports). Agent configuration settings, such as the agent listening port and the Jenkins master URL, must be correctly configured on the agent side. Incorrect agent configuration can prevent agents from connecting to the Jenkins master. Troubleshooting agent connectivity issues often involves examining agent status, agent logs, network connectivity, firewall rules, and agent configuration settings.
Resolving Jenkins Plugin Conflicts
Jenkins plugin conflicts can arise when incompatible plugins are installed or when plugins have dependencies on different versions of shared libraries. Plugin conflicts can manifest in various ways, including Jenkins instability, unexpected errors during pipeline execution, or plugins malfunctioning. If you suspect plugin conflicts, the first step is to examine the Jenkins system logs. Jenkins system logs often contain error messages or warnings related to plugin conflicts or plugin initialization failures. These logs can provide clues about which plugins are conflicting and the nature of the conflict.
Jenkins provides a "Safe Mode" that can be used to temporarily disable all plugins and start Jenkins with only core functionality. Starting Jenkins in Safe Mode can help determine if a plugin conflict is indeed the root cause of the problem. If Jenkins works correctly in Safe Mode, then a plugin conflict is likely. To identify the conflicting plugin, you can selectively disable plugins one by one or in groups, restarting Jenkins after each change, until the issue is resolved.
Once the conflicting plugin is identified, consider uninstalling or downgrading the plugin to a compatible version. Check the Jenkins plugin compatibility matrix or plugin documentation for information about plugin dependencies and compatibility with other plugins. Regularly updating plugins to their latest versions can sometimes resolve plugin conflicts, but it's important to test plugin updates in a non-production environment first to avoid introducing new issues.
Memory and Resource Management in Jenkins Pipelines
Memory and resource management in Jenkins pipelines is crucial for ensuring pipeline stability and preventing performance issues. Pipelines, especially complex ones, can consume significant system resources, including CPU, memory, and disk space. Insufficient resources can lead to pipeline slowdowns, build failures, or even Jenkins crashes. Monitor resource utilization of Jenkins master and agents during pipeline execution. Tools like top, htop, or system monitoring dashboards can be used to track CPU usage, memory consumption, and disk I/O. High resource utilization, especially consistently high CPU or memory usage, might indicate resource bottlenecks.
Jenkins provides configuration options to control resource allocation for pipelines and agents. Agent configurations can specify the number of executors (concurrent pipelines that can run on an agent) and resource limits for individual pipelines. Pipeline scripts can also be optimized to reduce resource consumption. For example, avoid unnecessary resource-intensive operations, optimize build processes, and use efficient algorithms. Consider using lightweight build agents or containerized build environments to isolate pipeline executions and manage resource allocation more effectively. Regularly review pipeline resource requirements and adjust Jenkins and agent configurations as needed to ensure efficient resource utilization and prevent resource-related pipeline issues.
Best Practices for Preventing Jenkins and Git Pipeline Failures
Preventing Jenkins and Git pipeline failures is as important as debugging them. Adopting best practices in pipeline design, scripting, configuration management, and testing can significantly reduce the frequency and impact of pipeline failures, leading to more stable and reliable CI/CD processes.
Implementing Robust Error Handling in Pipeline Scripts
Implementing robust error handling in pipeline scripts is a proactive measure to prevent pipeline failures and improve their resilience. Well-designed error handling allows pipelines to gracefully manage unexpected situations, provide informative error messages, and potentially recover from transient errors. Utilize try-catch blocks extensively in Groovy scripts to handle potential exceptions that might occur during pipeline execution. Within catch blocks, log detailed error information, including the exception type, error message, and stack trace. This detailed logging is crucial for debugging and understanding the root cause of errors.
Implement retry mechanisms for transient errors. Many pipeline failures are caused by temporary issues, such as network glitches or temporary unavailability of external services. Using the retry step in Jenkins pipelines allows for automatically retrying a failing step or stage a certain number of times. Configure retry policies with appropriate backoff strategies to avoid overwhelming failing services with repeated requests. For critical pipeline steps, consider implementing circuit breaker patterns. A circuit breaker can automatically stop execution of a failing step or stage after a certain number of consecutive failures, preventing cascading failures and allowing time for the underlying issue to be resolved. Robust error handling, including try-catch blocks, retry mechanisms, and circuit breakers, significantly enhances pipeline resilience and reduces the impact of transient errors.
Regularly Updating Jenkins and Git Plugins
Regularly updating Jenkins and Git plugins is a crucial maintenance task for ensuring pipeline stability and security. Plugin updates often include bug fixes, performance improvements, and security patches that address known vulnerabilities. Outdated plugins can contain bugs or security flaws that can lead to pipeline failures or security breaches. Establish a regular schedule for reviewing and updating Jenkins plugins.
Jenkins provides notifications when plugin updates are available. Before updating plugins in a production environment, always test the updates in a non-production or staging environment first. Plugin updates can sometimes introduce compatibility issues or unexpected behavior. Testing in a staging environment allows for identifying and resolving any such issues before they impact production pipelines.
Keep Git plugins, specifically those related to Git integration in Jenkins, up to date as well. Git plugin updates often include improvements in Git command execution, performance enhancements, and bug fixes related to Git operations. Review the release notes for plugin updates to understand the changes and potential impact on your pipelines. Consider using a plugin management tool or script to automate the plugin update process and ensure consistency across Jenkins installations. Regular plugin updates are a vital part of maintaining a secure and stable Jenkins environment and preventing plugin-related pipeline failures.
Using Version Control for Jenkins Pipeline Definitions
Using version control for Jenkins pipeline definitions, typically stored in Jenkinsfiles within Git repositories, is a fundamental best practice for managing and maintaining pipelines effectively. Storing pipeline definitions in version control provides a complete history of pipeline changes, allowing for easy rollback to previous versions if necessary. Version control enables collaboration on pipeline definitions. Multiple developers can work on pipeline changes concurrently, using Git branching and merging workflows to manage changes and resolve conflicts. Treat Jenkinsfile changes as code changes and follow standard software development practices, such as code reviews and testing, for pipeline modifications.
Version control facilitates pipeline as code. Pipeline definitions are treated as code artifacts, promoting consistency and reproducibility. Changes to pipeline definitions are tracked, auditable, and can be easily deployed and managed. Store Jenkinsfiles in the same Git repository as the application code that the pipeline builds and deploys. This colocated approach ensures that pipeline definitions are always in sync with the application code and simplifies pipeline management. Using version control for Jenkins pipeline definitions is essential for pipeline maintainability, collaboration, and promoting the principles of pipeline as code.
Properly Configuring Git Credentials in Jenkins
Properly configuring Git credentials in Jenkins is crucial for secure and reliable Git interactions within pipelines. Incorrectly configured or insecurely stored Git credentials can lead to pipeline failures, security vulnerabilities, and unauthorized access to Git repositories. Use Jenkins Credentials Management to securely store and manage Git credentials. Jenkins Credentials Management provides secure storage for various types of credentials, including usernames and passwords, SSH keys, and secret text. Avoid hardcoding Git credentials directly in Jenkins pipeline scripts or configurations. Hardcoding credentials is insecure and makes credential management difficult.
Use specific credentials for Jenkins pipelines rather than reusing personal developer credentials. Create dedicated service accounts or bot users for Jenkins to access Git repositories. This improves security and auditability. For SSH-based Git authentication, use SSH keys instead of passwords whenever possible. SSH keys are more secure and provide passwordless authentication.
When configuring SSH keys in Jenkins Credentials Management, ensure that the private key is stored securely and that the passphrase, if any, is managed appropriately. Regularly review and rotate Git credentials used by Jenkins pipelines. Credential rotation is a security best practice to minimize the impact of compromised credentials. Proper Git credential configuration in Jenkins is essential for secure and reliable Git operations and for preventing credential-related pipeline failures and security risks.
Testing Jenkins Pipelines Thoroughly Before Deployment
Testing Jenkins pipelines thoroughly before deployment is paramount for ensuring pipeline reliability and preventing unexpected failures in production. Treat pipeline definitions as code and apply the same rigorous testing practices as you would for application code. Implement unit tests for individual pipeline stages or functions, especially for complex Groovy scripts within the pipeline.
Unit tests verify the logic and behavior of individual pipeline components in isolation. Create integration tests that test the interaction between different pipeline stages and external systems, such as Git repositories, build tools, and deployment environments. Integration tests ensure that pipeline stages work together correctly and that integrations with external systems are functioning as expected.
Perform end-to-end tests that simulate the entire pipeline execution flow, from code checkout to deployment. End-to-end tests validate the complete pipeline workflow and identify any issues that might arise during the full pipeline execution. Use a dedicated testing environment or staging environment to test pipeline changes before deploying them to production. Testing in a non-production environment minimizes the risk of introducing failures into production pipelines.
Automate pipeline testing as much as possible. Automated tests can be integrated into the pipeline itself, ensuring that pipeline changes are automatically tested before being deployed. Thorough pipeline testing, including unit tests, integration tests, end-to-end tests, and testing in staging environments, is crucial for ensuring pipeline quality and preventing production failures.
Advanced Debugging Strategies for Complex Jenkins Git Pipelines
As Jenkins Git pipelines grow in complexity, basic debugging techniques might become insufficient. Advanced debugging strategies are needed to effectively troubleshoot intricate pipeline issues, optimize performance, and maintain pipeline robustness in complex CI/CD environments.
Using Jenkins Declarative Pipelines for Easier Debugging
Using Jenkins Declarative Pipelines can simplify debugging compared to Scripted Pipelines, especially for complex workflows. Declarative Pipelines provide a structured and more readable syntax, making it easier to understand the pipeline flow and identify potential issues. The declarative structure enforces best practices and reduces the chances of introducing scripting errors. Declarative Pipelines have built-in error handling and logging mechanisms that can simplify debugging. The options block allows for configuring pipeline-wide options, such as timeouts and retry strategies, which can improve pipeline robustness and debuggability.
Declarative Pipelines often use plugins that provide visual representations of the pipeline execution flow, making it easier to track pipeline progress and identify bottlenecks or failures. The structured nature of Declarative Pipelines makes them more amenable to static analysis tools and linters, which can detect potential errors or style issues in the pipeline definition before execution. While Scripted Pipelines offer more flexibility, Declarative Pipelines often provide a better balance between flexibility and debuggability for complex workflows, especially for teams that are new to Jenkins pipeline scripting. Consider migrating complex Scripted Pipelines to Declarative Pipelines to improve debuggability and maintainability.
Leveraging Jenkins Shared Libraries is an advanced technique for managing reusable pipeline code and simplifying debugging in complex Jenkins environments. Shared Libraries allow for defining reusable pipeline steps, functions, and utility classes in external Git repositories. This promotes code reuse, reduces code duplication, and makes pipeline definitions more modular and maintainable. By centralizing common pipeline logic in Shared Libraries, debugging efforts can be focused on the core pipeline logic rather than repeatedly debugging the same code in different pipelines. Shared Libraries can be versioned and managed using Git, providing version control and auditability for reusable pipeline code.
Shared Libraries can include unit tests and integration tests for reusable pipeline components. Testing Shared Libraries in isolation ensures the quality and reliability of reusable pipeline code, reducing the chances of introducing errors into pipelines that use these libraries. Shared Libraries can be used to encapsulate complex debugging logic or utility functions that can be reused across multiple pipelines. This can simplify debugging by providing standardized debugging tools and techniques. Using Jenkins Shared Libraries is a powerful strategy for managing complex pipeline code, promoting code reuse, and simplifying debugging in large Jenkins environments.
Integrating Static Code Analysis Tools for Early Error Detection
Integrating static code analysis tools into Jenkins pipelines is a proactive approach to detect potential errors and code quality issues early in the development lifecycle, before they lead to pipeline failures or runtime problems. Static code analysis tools can automatically scan pipeline scripts (Jenkinsfiles and Groovy code in Shared Libraries) for syntax errors, style violations, security vulnerabilities, and potential logical errors.
Tools like SonarQube, Checkstyle, FindBugs, and ESLint can be integrated into Jenkins pipelines to perform static code analysis. Static analysis can identify issues that might not be caught by unit tests or integration tests, such as code complexity, potential null pointer exceptions, or security weaknesses.
Configure static code analysis tools to fail the pipeline build if critical issues are detected. This enforces code quality standards and prevents pipelines with potential errors from proceeding to later stages. Static code analysis results can be presented in Jenkins reports or dashboards, providing developers with feedback on code quality and highlighting areas that need improvement.
Integrate static code analysis early in the pipeline, preferably before build or test stages. Early detection of errors reduces the cost and effort required to fix them. Using static code analysis tools as part of Jenkins pipelines is a valuable strategy for improving code quality, reducing errors, and preventing pipeline failures.
Using retry step with exponential backoff for transient errors
Using the retry step with exponential backoff is an advanced error handling technique for Jenkins pipelines, particularly effective for dealing with transient errors that are common in distributed systems and network environments. Transient errors are temporary issues that are often resolved automatically after a short period, such as network glitches, temporary unavailability of external services, or resource contention. The retry step in Jenkins allows for automatically retrying a failing step or stage a specified number of times. Exponential backoff is a strategy for increasing the delay between retry attempts. This prevents overwhelming failing services with repeated requests and gives them time to recover.
When using exponential backoff, the delay between retry attempts increases exponentially with each subsequent attempt. For example, the first retry might be attempted after 1 second, the second after 2 seconds, the third after 4 seconds, and so on. This backoff strategy reduces the load on failing services and increases the chances of successful recovery on subsequent retry attempts. Configure the retry step with an appropriate number of retry attempts and a suitable base backoff duration. The number of retry attempts and backoff duration should be tuned based on the expected frequency and duration of transient errors in the pipeline environment. Using the retry step with exponential backoff is a robust error handling technique for improving pipeline resilience and handling transient errors gracefully.
Implementing Pipeline Visualization Tools for Complex Workflows
Implementing pipeline visualization tools is highly beneficial for debugging and understanding complex Jenkins workflows, especially pipelines with many stages, parallel executions, and intricate dependencies. Pipeline visualization tools provide graphical representations of pipeline execution flow, stage status, and dependencies between stages. Jenkins plugins like "Pipeline Graph View" and "Blue Ocean" offer visualization capabilities for Declarative Pipelines. These visualizations make it easier to track pipeline progress, identify bottlenecks, and understand the overall pipeline execution flow. Visualizations can highlight failing stages or steps, making it quicker to pinpoint the source of pipeline failures.
Pipeline visualization tools can show the execution time for each stage, helping to identify performance bottlenecks in the pipeline. Some visualization tools provide drill-down capabilities, allowing developers to examine detailed logs and output for individual stages or steps directly from the visualization interface. For complex pipelines with parallel stages or conditional execution paths, visualizations are invaluable for understanding the execution flow and dependencies.
Consider using pipeline visualization plugins for Jenkins to enhance debuggability and understanding of complex pipeline workflows. Visualizations are particularly helpful for teams working with complex CI/CD pipelines and for onboarding new team members to understand pipeline workflows.
Case Studies: Real-World Jenkins Git Pipeline Debugging Scenarios
Real-world case studies provide practical examples of Jenkins Git pipeline debugging scenarios, illustrating common problems, debugging approaches, and effective solutions. These case studies offer valuable insights and practical guidance for troubleshooting pipeline failures in real-world CI/CD environments.
Case Study 1: Resolving a Git Authentication Issue in a Jenkins Pipeline
Scenario: A Jenkins pipeline suddenly started failing at the Git clone stage with a "Git clone failed: Could not read from remote repository" error. No recent changes were made to the pipeline definition or Git repository configuration.
Debugging Process:
- Examined Jenkins Console Output: The console output clearly indicated a "Git clone failed" error and suggested checking repository access permissions and credentials.
- Verified Git Repository URL: Confirmed that the Git repository URL in the Jenkinsfile was correct and accessible.
- Checked Jenkins Credentials: Reviewed the Git credentials configured in Jenkins Credentials Management. Realized that the password for the Git user account had recently expired and was not updated in Jenkins.
- Updated Git Credentials: Updated the expired password for the Git user account in Jenkins Credentials Management.
- Retried Pipeline: Reran the Jenkins pipeline. The Git clone stage succeeded, and the pipeline continued to execute successfully.
Solution: The Git authentication issue was resolved by updating the expired password for the Git user account in Jenkins Credentials Management. This case study highlights the importance of regularly checking and maintaining Git credentials used by Jenkins pipelines, especially passwords that might expire.
Case Study 2: Debugging a Complex Groovy Script Error in Jenkins
Scenario: A Jenkins pipeline with a complex Groovy script in one of its stages started failing intermittently with a "java.lang.NullPointerException" error. The console output showed the error occurring within the Groovy script but did not immediately pinpoint the exact line of code.
Debugging Process:
- Examined Jenkins Console Output: Reviewed the console output and identified the stage where the error occurred and the "java.lang.NullPointerException". The stack trace provided limited context within the Groovy script.
- Added
printlnStatements for Debugging: Modified the Groovy script by addingprintlnstatements to output variable values at various points in the script, especially before the line of code suspected to be causing the NullPointerException. - Reran Pipeline with Debugging Output: Reran the pipeline with the added
printlnstatements. The console output now showed the values of variables at different points in the script, revealing that a variable expected to be initialized was unexpectedly null in certain execution paths. - Identified Logical Error in Groovy Script: Analyzed the Groovy script logic and identified a conditional branch where the variable initialization was being skipped under certain conditions, leading to the NullPointerException later in the script.
- Fixed Groovy Script Logic: Modified the Groovy script to ensure that the variable was always initialized regardless of the execution path.
- Removed Debugging
printlnStatements: Removed the debuggingprintlnstatements from the Groovy script. - Reran Pipeline: Reran the Jenkins pipeline. The pipeline executed successfully without the NullPointerException error.
Solution: The Groovy script error was resolved by identifying and fixing a logical error in the script that was causing a variable to be unexpectedly null. This case study demonstrates the effectiveness of using println statements for debugging complex Groovy scripts in Jenkins pipelines and tracking variable values to pinpoint logical errors.
Case Study 3: Addressing Intermittent Test Failures Due to External API Rate Limiting
Scenario: A Jenkins pipeline started experiencing intermittent test failures in an integration test stage that interacted with an external API. The test failures were sporadic and difficult to reproduce consistently. The console output showed timeout errors or HTTP 429 "Too Many Requests" errors from the external API.
Debugging Process:
- Examined Jenkins Console Output: Reviewed the console output and noticed timeout errors and HTTP 429 errors from the external API during the integration test stage. This suggested potential issues with the external API's availability or rate limiting.
- Monitored External API Status: Checked the status page and monitoring dashboards for the external API. Confirmed that the API was generally available but might be experiencing occasional performance fluctuations or rate limiting.
- Implemented Retry Logic with Exponential Backoff: Modified the integration test stage in the Jenkins pipeline to implement retry logic with exponential backoff for API calls. Used the
retrystep in Jenkins pipeline with an exponential backoff strategy to handle transient API errors. - Adjusted Retry Parameters: Tuned the retry parameters (number of retries, initial backoff duration, and maximum backoff duration) based on the external API's rate limit documentation and observed behavior.
- Reran Pipeline with Retry Logic: Reran the Jenkins pipeline with the implemented retry logic. The pipeline now handled transient API errors more gracefully, and the intermittent test failures were significantly reduced.
Solution: The intermittent test failures due to external API rate limiting were addressed by implementing retry logic with exponential backoff in the Jenkins pipeline. This case study highlights the importance of handling transient errors and rate limiting when interacting with external APIs in Jenkins pipelines and using retry mechanisms to improve pipeline resilience.
Conclusion: Mastering Jenkins and Git Pipeline Debugging
Mastering Jenkins and Git pipeline debugging is an essential skill for any DevOps engineer or developer working with CI/CD systems. Effective debugging ensures pipeline stability, reduces downtime, and maintains development velocity. This article has explored common causes of pipeline failures, various debugging techniques, best practices for prevention, and advanced debugging strategies for complex pipelines.
Key Takeaways for Effective Pipeline Troubleshooting
Effective pipeline troubleshooting relies on a systematic approach, starting with understanding common failure causes, utilizing available debugging tools and techniques, and applying best practices for prevention. Always begin by carefully examining the Jenkins console output for error messages and contextual information. Utilize Git logs to analyze Git operations and identify branching or merging issues.
Implement robust error handling and logging in pipeline scripts to proactively catch and diagnose errors. Employ advanced debugging techniques like remote debugging and pipeline visualization for complex workflows. Proactively prevent pipeline failures by following best practices, such as regularly updating plugins, using version control for pipeline definitions, properly configuring Git credentials, and thoroughly testing pipelines before deployment.
Continuous Improvement of Jenkins and Git Integration
Continuous improvement of Jenkins and Git integration is an ongoing process. Regularly review pipeline performance, identify bottlenecks, and optimize pipeline execution. Monitor pipeline health and stability, track failure rates, and analyze root causes of failures to implement preventative measures.
Stay updated with the latest Jenkins and Git features, best practices, and security updates. Continuously learn and adapt debugging techniques and strategies to handle evolving pipeline complexities and emerging challenges in CI/CD environments. By embracing a culture of continuous improvement, teams can build more robust, reliable, and efficient Jenkins and Git pipelines, contributing to faster software delivery and improved overall DevOps practices.
Frequently Asked Questions
What are some common causes of Jenkins Git pipeline failures?
Common causes include incorrect Git configurations, authentication problems, and script errors within the pipeline itself. These can lead to the pipeline failing to clone the repository or execute correctly.
How can I check the Jenkins console output for clues about pipeline failures?
The Jenkins console output provides a detailed log of the pipeline's execution. Look for error messages and stack traces that indicate where the failure occurred.
What role does Git authentication play in potential pipeline failures?
Incorrect or expired Git credentials can prevent Jenkins from accessing the repository. Ensure your credentials are correctly configured and have the necessary permissions.
What are some strategies for debugging Git commands within a Jenkins pipeline?
Use the sh step in your Jenkinsfile to execute Git commands with debugging options like -v (verbose). This helps to see the exact commands being executed and their output.
How can I ensure my Jenkins pipeline is integrated correctly with GitHub or GitLab?
Verify that your webhook configurations are set up correctly on GitHub or GitLab to trigger the pipeline on commits. Test the connection to ensure Jenkins can communicate with the remote repository.
Final Reflection: Mastering Pipeline Resilience
The intricacies of Jenkins and Git pipelines, while powerful, often present frustrating debugging challenges. Understanding these challenges and developing effective troubleshooting strategies is now more critical than ever, as continuous integration and continuous delivery (CI/CD) become the backbone of modern software development. A stable and reliable pipeline directly translates to faster release cycles, reduced errors, and ultimately, a more competitive product.
The ability to effectively debug Jenkins and Git issues has profoundly impacted the software development landscape, fostering a culture of rapid iteration and continuous improvement. Personally, witnessing a team overcome a seemingly insurmountable pipeline failure through methodical debugging is incredibly rewarding, highlighting the importance of these skills. The best error message is the one that never shows up.
- Thomas Fuller. This quote underscores the ultimate goal: to build robust pipelines that anticipate and prevent issues, but when they do arise, to be equipped to resolve them swiftly and efficiently.
As you navigate the complex world of CI/CD, remember that mastering the art of debugging Jenkins and Git pipelines is not just about fixing errors; it's about building resilience, fostering collaboration, and driving innovation. Take the lessons learned here, apply them to your own workflows, and strive to create pipelines that are not only functional but also robust, reliable, and a source of pride for your team. Your dedication to continuous improvement will undoubtedly contribute to the success of your projects and the advancement of the software development industry as a whole.
Conquer Your Code: Master Git and Jenkins!
This article explored pipeline debugging, offering insights into resolving frustrating Jenkins and Git issues. Now, put that knowledge to work and elevate your DevOps skills.
Ready to prevent pipeline failures? Here's how:
- Implement a new debugging strategy based on the techniques discussed. Tackle at least one challenging pipeline today.
- Share your most challenging Git or Jenkins debugging experience in the comments below and learn from the community.
- Proactively prevent errors by using Git hooks to identify pipeline bottlenecks before they impact your CI/CD process.
What Git technique will you use this week to prevent future pipeline failures? Let's discuss!