
Troubleshooting Common CI/CD Pipeline Issues: A Practical Guide

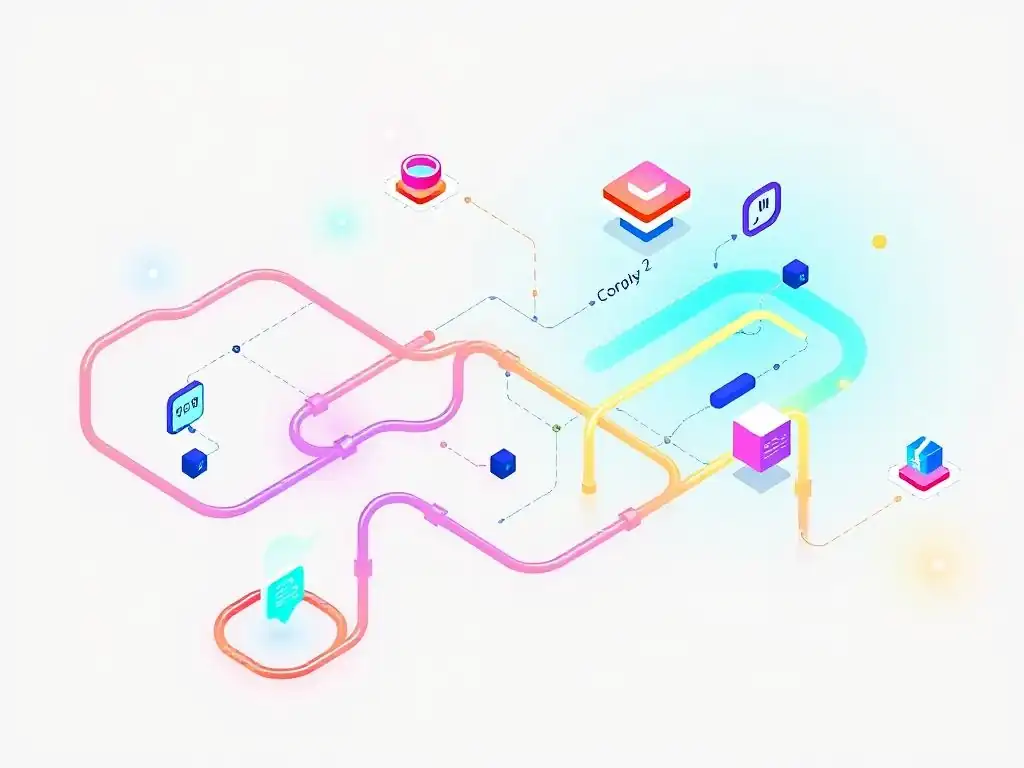
Welcome to Git and Version Control Hub, your central resource for mastering Git and its powerful applications!
Are your CI/CD pipelines feeling more like roadblocks than smooth pathways? Discover essential CI/CD pipeline troubleshooting tips in our latest guide. We'll help you navigate common pitfalls and optimize your workflow, ensuring seamless integration and deployment. Intrigued? Dive in and unlock the secrets to building robust and reliable pipelines. Explore the full article below and elevate your Git mastery within the Navigating the Git Tool Ecosystem category.
- Practical CI/CD Pipeline Troubleshooting Tips and Techniques
-
Frequently Asked Questions
- What are some common causes of CI/CD pipeline failures?
- How can I effectively troubleshoot failing CI/CD pipeline stages?
- What role does version control play in CI/CD pipeline troubleshooting?
- How important is testing in preventing CI/CD pipeline failures?
- What are some best practices for maintaining a stable CI/CD pipeline?
- Final Reflection: Embracing Resilience in the CI/CD Journey
- Unblock Your Pipeline: Take Control of Your Builds!
Practical CI/CD Pipeline Troubleshooting Tips and Techniques
Analyzing Pipeline Logs: Deciphering Error Messages and Identifying Bottlenecks
Pipeline logs are the primary source of truth when troubleshooting CI/CD issues. They record every step of your pipeline execution, from code checkout to deployment, providing a detailed history of events. Effective CI/CD pipeline troubleshooting often starts with a thorough examination of these logs.
Error messages, warnings, and even seemingly innocuous informational messages can hold crucial clues. Look for red flags such as stack traces, exceptions, or timeouts, as these typically pinpoint the stage where the pipeline faltered. Understanding the timestamped sequence of log entries allows you to trace the execution flow and identify the exact point of failure, whether it's a failed test, a deployment error, or a configuration issue.
To effectively analyze logs, familiarize yourself with common error message patterns from your CI/CD platform and the tools within your pipeline (e.g., build tools, testing frameworks, deployment scripts). For instance, a "command not found" error clearly indicates a missing dependency or an incorrect path configuration in your pipeline script. Similarly, network errors in deployment logs might suggest firewall issues or connectivity problems with your target environment. By systematically reading through the logs, starting from the point of failure and working backwards, you can often pinpoint the root cause of pipeline problems and gain valuable CI/CD pipeline troubleshooting tips.
Using Logging Tools Like ELK Stack to Centralize and Analyze Logs
For complex CI/CD pipelines, especially those involving microservices or distributed systems, relying on individual pipeline logs can become cumbersome and inefficient. Logging tools like the ELK Stack (Elasticsearch, Logstash, Kibana) offer a centralized solution for aggregating, indexing, and visualizing logs from various sources within your CI/CD ecosystem. ELK Stack enables you to collect logs not only from your CI/CD platform itself (e.g., Jenkins, GitLab CI, GitHub Actions) but also from your applications, servers, and infrastructure. This centralized view provides a holistic picture of your pipeline's health and performance, making CI/CD pipeline troubleshooting significantly easier.
With Kibana, the visualization component of ELK Stack, you can create dashboards to monitor key pipeline metrics, visualize error trends over time, and perform powerful log searches using Elasticsearch's query language. For example, you can set up dashboards to track build durations, deployment success rates, and the frequency of specific error types.
This proactive monitoring can help you identify potential issues before they escalate into major pipeline failures, enhancing your proactive CI/CD pipeline troubleshooting capabilities. Furthermore, the ability to correlate logs from different parts of your system within a single platform accelerates root cause analysis and reduces the mean time to resolution (MTTR) for pipeline incidents.
Filtering Logs for Specific Errors and Warnings
When dealing with verbose pipeline logs, filtering becomes essential for efficient CI/CD pipeline troubleshooting. Modern CI/CD platforms and logging tools offer powerful filtering capabilities that allow you to narrow down the log output to focus on specific errors, warnings, or events of interest. Instead of sifting through thousands of lines of logs, you can use filters to isolate relevant information and quickly identify the source of a problem. For example, you can filter logs by job name, stage name, error level (e.g., ERROR, WARNING), or specific keywords related to the error you are investigating.
Effective filtering strategies can dramatically reduce the time spent on CI/CD pipeline troubleshooting. For instance, if you suspect a test failure is causing a pipeline issue, you can filter the logs to show only the output from the test execution stage. Within that filtered output, you can further refine your search by looking for keywords like "fail", "error", or the name of a specific test case.
Regular expressions can also be used for more complex filtering patterns, enabling you to extract specific data points or identify recurring error patterns. By mastering log filtering techniques, you can efficiently navigate through pipeline logs and pinpoint the root cause of failures, improving your overall CI/CD pipeline troubleshooting workflow.
Reproducing Errors Locally: Isolating and Debugging Issues
Once you've identified a potential error in your CI/CD pipeline logs, the next crucial step in CI/CD pipeline troubleshooting is to reproduce the error locally. Replicating the pipeline environment on your local machine allows you to isolate the issue from the complexities of the CI/CD infrastructure and use familiar debugging tools to investigate it thoroughly.
This approach is particularly effective for issues related to code compilation, dependency resolution, or application runtime errors. By reproducing the error locally, you can iterate quickly, test fixes in isolation, and gain a deeper understanding of the problem before pushing changes back to the CI/CD pipeline.
Reproducing errors locally often involves setting up a development environment that closely mirrors the CI/CD pipeline environment. This might include using the same operating system, programming language versions, dependency versions, and environment variables. The goal is to create a controlled environment where you can reliably trigger the same error that occurred in the pipeline.
Once the error is reproduced locally, you can employ standard debugging techniques like stepping through the code, setting breakpoints, and inspecting variables to pinpoint the root cause. This iterative process of reproducing, debugging, and testing locally significantly accelerates CI/CD pipeline troubleshooting and reduces the feedback loop for resolving issues.
Using Docker to Replicate the CI/CD Environment
Docker has become an indispensable tool for CI/CD pipeline troubleshooting, particularly when it comes to replicating pipeline environments locally. Docker containers provide a consistent and isolated environment that mirrors the execution environment of your CI/CD pipeline. By containerizing your application and its dependencies, you can ensure that your local development environment closely matches the environment where your CI/CD pipeline runs, minimizing environment-specific discrepancies that can lead to "it works on my machine" scenarios.
To use Docker for CI/CD pipeline troubleshooting, you can define a Dockerfile that specifies the base image, dependencies, and configurations required to run your application. This Dockerfile should ideally be aligned with the Docker images used in your CI/CD pipeline stages. Once you have a Dockerfile, you can build a Docker image and run a container locally.
Within this containerized environment, you can execute the same commands and scripts that are used in your CI/CD pipeline, effectively replicating the pipeline's execution context. Docker's ability to create reproducible and portable environments significantly streamlines CI/CD pipeline troubleshooting by enabling developers to debug issues in a consistent and isolated setting.
Debugging with Interactive Debuggers in VS Code
Interactive debuggers, such as those integrated within IDEs like VS Code, are powerful allies in CI/CD pipeline troubleshooting when you have successfully reproduced an error locally. Instead of relying solely on print statements or log messages, interactive debuggers allow you to step through your code line by line, inspect variable values at runtime, and set breakpoints to pause execution at specific points of interest. This level of control and visibility into your application's execution flow is invaluable for understanding complex bugs and pinpointing their root cause.
VS Code, with its rich debugging capabilities and extensions for various programming languages, is particularly well-suited for CI/CD pipeline troubleshooting. You can configure VS Code to attach to a running Docker container, allowing you to debug your application within the replicated CI/CD environment. By setting breakpoints in your code and stepping through the execution flow, you can observe the application's state at each step, identify unexpected behavior, and gain a deeper understanding of the error. Interactive debuggers significantly enhance CI/CD pipeline troubleshooting by providing a more efficient and insightful debugging experience compared to traditional logging-based methods.
Implementing Robust Error Handling: Preventing Future Failures
While effective CI/CD pipeline troubleshooting is crucial for resolving immediate issues, implementing robust error handling mechanisms is equally important for preventing future failures and building more resilient pipelines. Proactive error handling reduces the frequency of pipeline failures, minimizes downtime, and improves the overall reliability of your software delivery process. This involves anticipating potential points of failure in your pipeline and implementing strategies to gracefully handle errors, recover from transient issues, and provide informative feedback when failures occur.
Robust error handling in CI/CD pipelines encompasses several techniques, including implementing retry mechanisms for transient errors, incorporating circuit breakers to prevent cascading failures, and designing rollback procedures to revert to a previous stable state in case of deployment failures. Furthermore, comprehensive error logging and alerting are essential for quickly detecting and responding to pipeline issues. By proactively incorporating error handling best practices into your CI/CD pipeline design, you can significantly reduce the impact of errors, improve pipeline stability, and minimize the need for reactive CI/CD pipeline troubleshooting in the long run.
Using Retry Mechanisms for Transient Errors
Transient errors, such as temporary network glitches, intermittent service outages, or resource contention, are common occurrences in distributed systems and can cause sporadic failures in CI/CD pipelines. Implementing retry mechanisms is a fundamental error handling technique to address these transient issues. Retry mechanisms automatically re-execute a failed pipeline step or task a certain number of times, with a configurable delay between retries. This approach allows the pipeline to gracefully recover from transient errors without manual intervention, improving its resilience and reducing the need for manual CI/CD pipeline troubleshooting for such issues.
When implementing retry mechanisms, it's crucial to configure appropriate retry policies. This includes defining the maximum number of retries, the delay between retries (often using exponential backoff to avoid overwhelming failing services), and the conditions under which a retry should be attempted. For example, you might configure retries for network-related errors but not for application-level errors that indicate a code bug. By strategically using retry mechanisms, you can build more robust CI/CD pipelines that are less susceptible to transient failures and require less reactive CI/CD pipeline troubleshooting for intermittent issues.
Implementing Rollback Procedures for Failed Deployments
Deployment failures are a critical concern in CI/CD pipelines, as they can lead to service disruptions and impact users. Implementing rollback procedures is a vital error handling strategy to mitigate the impact of failed deployments. A rollback procedure automatically reverts a failed deployment to the previous stable version of the application, ensuring that the system returns to a functional state quickly. This minimizes downtime and reduces the need for urgent CI/CD pipeline troubleshooting to manually fix a broken deployment.
Rollback procedures typically involve maintaining a record of previous application versions and configurations. In case of a deployment failure, the pipeline automatically triggers a rollback, redeploying the previously successful version. The implementation of rollback procedures varies depending on the deployment strategy and infrastructure.
For example, in blue/green deployments or canary deployments, rollbacks can be achieved by simply switching traffic back to the previous environment. By incorporating robust rollback procedures into your CI/CD pipeline, you can significantly improve the system's resilience to deployment failures and minimize the impact of such incidents, reducing the pressure on CI/CD pipeline troubleshooting teams during critical outages.
Utilizing CI/CD Pipeline Monitoring Tools: Proactive Issue Detection
While reactive CI/CD pipeline troubleshooting is essential for resolving existing issues, proactive monitoring is crucial for preventing failures and ensuring the long-term health and efficiency of your pipelines. CI/CD pipeline monitoring tools provide real-time visibility into pipeline performance, allowing you to track key metrics, identify bottlenecks, and detect anomalies before they escalate into major problems. Proactive monitoring enables you to shift from a reactive troubleshooting approach to a more preventative and optimized CI/CD pipeline management strategy.
Effective CI/CD pipeline monitoring involves tracking various metrics, such as pipeline execution times, build durations, test pass rates, deployment frequencies, and error rates. Monitoring tools typically provide dashboards and visualizations that allow you to easily monitor these metrics and identify trends or anomalies. Furthermore, alerting mechanisms can be configured to notify you automatically when critical thresholds are breached or when potential issues are detected. By leveraging CI/CD pipeline monitoring tools, you can proactively identify and address performance bottlenecks, configuration issues, or potential failure points, improving pipeline reliability and reducing the need for frequent CI/CD pipeline troubleshooting interventions.
Leveraging Monitoring Tools Like Prometheus for Real-Time Insights
Prometheus is a popular open-source monitoring and alerting toolkit that is widely used for monitoring CI/CD pipelines and infrastructure. It excels at collecting and storing time-series data, enabling you to track pipeline metrics in real-time and gain valuable insights into pipeline performance and health. Prometheus's flexible query language, PromQL, allows you to create powerful queries to analyze metrics, identify trends, and create custom dashboards tailored to your specific CI/CD pipeline monitoring needs.
Prometheus integrates well with various CI/CD platforms and infrastructure components, allowing you to collect metrics from different parts of your CI/CD ecosystem. For example, you can monitor build times, test durations, deployment frequencies, and error rates directly from your CI/CD platform. You can also monitor the resource utilization of your build agents and deployment environments. By leveraging Prometheus, you can gain a comprehensive real-time view of your CI/CD pipeline's performance and health, empowering you to proactively identify and address potential issues before they impact your software delivery process, minimizing the need for reactive CI/CD pipeline troubleshooting.
Setting Up Alerts for Critical Pipeline Metrics
Alerting is a critical component of proactive CI/CD pipeline monitoring. Setting up alerts for critical pipeline metrics ensures that you are immediately notified when potential issues arise, allowing you to respond quickly and prevent major disruptions. Alerts can be configured to trigger based on various conditions, such as exceeding predefined thresholds for error rates, pipeline execution times, or build failures. Prompt and effective alerting minimizes downtime and reduces the need for extensive CI/CD pipeline troubleshooting in response to critical incidents.
When setting up alerts, it's important to define meaningful thresholds that accurately reflect potential problems without generating excessive false positives. Alerts should be routed to the appropriate teams or individuals who are responsible for CI/CD pipeline troubleshooting and maintenance.
Alerting mechanisms can range from simple email notifications to more sophisticated systems that integrate with incident management platforms. By proactively setting up alerts for critical pipeline metrics, you can significantly improve your responsiveness to pipeline issues, reduce the mean time to resolution (MTTR), and minimize the impact of failures on your software delivery process, shifting from reactive CI/CD pipeline troubleshooting to proactive pipeline management.
Frequently Asked Questions
What are some common causes of CI/CD pipeline failures?
Common CI/CD pipeline failures often stem from incorrect configurations, dependency issues, or environment inconsistencies between development and production. These issues can halt the entire process.
How can I effectively troubleshoot failing CI/CD pipeline stages?
Begin by examining the pipeline logs for error messages and stack traces. Then, isolate the failing stage and reproduce the issue locally for easier debugging.
What role does version control play in CI/CD pipeline troubleshooting?
Version control, specifically Git, allows you to revert to previous working states of your code and configurations. This helps identify when and where a problem was introduced, making debugging easier.
How important is testing in preventing CI/CD pipeline failures?
Thorough testing is crucial. Implementing robust unit, integration, and end-to-end tests can catch errors early, preventing them from reaching the CI/CD pipeline and causing failures.
What are some best practices for maintaining a stable CI/CD pipeline?
Adopt practices like infrastructure as code, automating deployments, and regularly monitoring pipeline performance. These minimize manual errors and improve overall pipeline reliability.
Final Reflection: Embracing Resilience in the CI/CD Journey
The relentless pace of modern software development demands efficiency and reliability, making robust CI/CD pipelines indispensable. The ability to effectively troubleshoot CI/CD pipelines is no longer a luxury, but a fundamental skill for any development team striving for continuous delivery. This guide has explored common pitfalls and practical solutions, highlighting the importance of proactive monitoring, clear communication, and a deep understanding of the underlying infrastructure.
The impact of a well-maintained CI/CD pipeline extends far beyond mere automation; it fosters a culture of collaboration, accelerates innovation, and ultimately, delivers value to the end-user faster. My own experience has shown that investing in CI/CD troubleshooting skills is an investment in the long-term health and agility of any software project. The only constant in software development is change. A resilient CI/CD pipeline is your best defense against the inevitable disruptions that come with it.
As you navigate the ever-evolving landscape of software development, remember that troubleshooting is not a sign of failure, but an opportunity for growth. Embrace the challenges, learn from your mistakes, and continuously refine your CI/CD pipelines. Let the knowledge gained from this guide empower you to build more robust, reliable, and ultimately, more successful software.
Unblock Your Pipeline: Take Control of Your Builds!
Thanks for diving into our guide on troubleshooting CI/CD pipeline issues! We hope you've gained valuable insights into identifying and resolving common roadblocks in your development process. Now, let's put that knowledge into action and optimize your workflows.
- Prioritize your pipeline health by implementing at least one new monitoring tool or alert this week. Start small, but start somewhere!
- Share your biggest pipeline challenge with a colleague or on a relevant forum. Collaborating on solutions can unlock unexpected insights.
- Document a recent pipeline fix in your team's knowledge base. Future you (and your teammates) will thank you!
What's the one pipeline issue you're tackling first, and how will you measure its success?