
Exploring Git's DAG: Visualizing Your Project's History Graph

Welcome to Git and Version Control Hub!
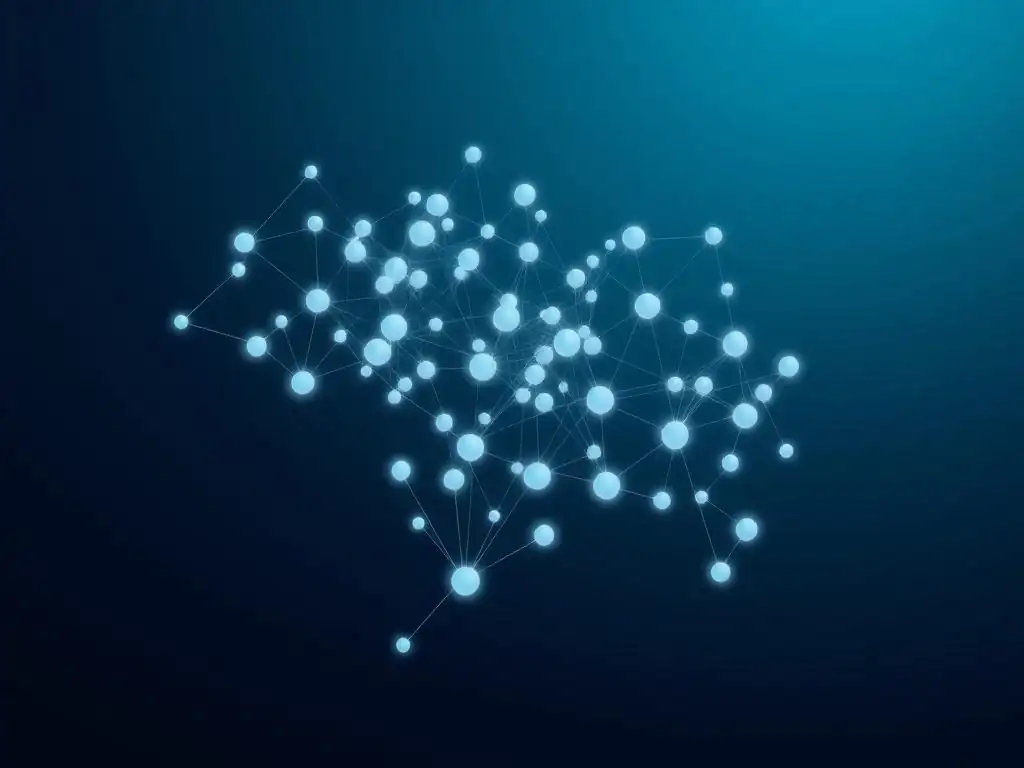
Ever wondered how to truly see the story of your project's evolution? This isn't just about committing code; it's about understanding the intricate web of changes that brought your software to life. Dive into our latest article, "Exploring Git's DAG: Visualizing Your Project's History Graph," and unlock the power of visualizing Git project history. Discover how understanding the Directed Acyclic Graph (DAG) can transform your debugging, collaboration, and overall Git mastery. Are you ready to see your project's past, present, and future with crystal clarity? Let's get started!
Exploring Git's DAG: Visualizing Your Project's History Graph
- Introduction to Git's Directed Acyclic Graph (DAG)
- Demystifying the Git Object Model and the DAG
- Tools for Visualizing Git Project History
- Interpreting the Git DAG: Branching, Merging, and Rebasing
- Advanced Techniques for Analyzing the Git DAG
- Best Practices for Maintaining a Clean and Understandable Git History
- Practical Examples of Visualizing Git Project History
- Conclusion: Mastering Git Through Visualizing Your Project's History
-
Frequently Asked Questions
- How does visualizing Git project history benefit developers?
- What is a DAG in the context of Git, and why is it important?
- What are some tools or techniques for visualizing Git project history?
- How can visualizing Git history help with debugging and resolving conflicts?
- What are some advanced concepts related to visualizing Git history, such as reflogs?
- Final Reflection: Embracing the Flow of Time
- Visualize & Conquer: Map Your Git Journey!
Introduction to Git's Directed Acyclic Graph (DAG)
Understanding the Core Concept: The DAG as Git's Foundation
At the heart of Git's powerful version control system lies the Directed Acyclic Graph, or DAG. This might sound complex, but in essence, the DAG is simply a way of visualizing your project's history as a series of interconnected points, each representing a snapshot in time. Think of it as a family tree, but for your code. Each commit in Git is a node in this graph, and the connections between these nodes illustrate the chronological order and branching of your project's development. This structure is fundamental to Git's ability to track changes, manage branches, and facilitate collaboration.
The DAG is not just an abstract concept; it's the very foundation upon which Git operates. Every command you execute in Git, from committing changes to merging branches, directly manipulates this graph. Understanding the DAG is crucial for grasping how Git manages version control, as it provides a clear and logical representation of the project’s evolution. Without the DAG, navigating and understanding the history of a project, especially a complex one with multiple branches and contributors, would be incredibly difficult. It's the map that guides you through the terrain of your codebase's history.
Why Visualizing Git Project History is Crucial for Developers
Visualizing Git project history is not merely a cosmetic enhancement; it's a vital skill for developers of all levels. Imagine trying to navigate a city without a map – that's akin to managing a Git repository without visualizing its history. By visualizing the DAG, developers gain a profound understanding of how their project has evolved over time. This visual representation allows them to easily track changes, understand branching strategies, and identify when and why specific modifications were made. This clarity is indispensable for debugging, code reviews, and collaboration within development teams.
Furthermore, visualizing project history significantly improves collaboration. When working in teams, understanding the contributions of each member and how branches diverge and merge is essential. A visual representation of the DAG makes it easier to communicate about project history, resolve conflicts, and ensure everyone is on the same page. Whether you are trying to understand the origin of a bug, review a feature branch, or simply get a grasp of the project’s overall development trajectory, visualizing the Git DAG is an invaluable tool for efficient and effective software development.
Demystifying the Git Object Model and the DAG
Commit Objects: The Building Blocks of the History Graph
Commit objects are the fundamental building blocks of Git's DAG. Each commit object represents a snapshot of your entire project at a specific point in time. Think of a commit as a saved game in a video game; it captures the state of everything at that precise moment.
Crucially, a commit object contains metadata about the snapshot, including the author (name and email), the committer (who actually made the commit, which can differ in certain scenarios like cherry-picking), a timestamp, and a commit message explaining the changes made. This metadata is critical for tracking authorship and understanding the context of each change.
Beyond metadata, each commit object points to a tree object, which we'll discuss shortly. It also points to its parent commit(s). This "parent" pointer is what creates the links in the DAG, connecting commits chronologically. The very first commit in a repository, the "root commit," has no parent.
Subsequent commits point back to their immediate predecessors, forming a chain. In the case of merges, a commit can have multiple parents, representing the merging of different branches of development. Therefore, commit objects are not just snapshots of code; they are the nodes that weave together the narrative of your project's history.
Tree Objects: Representing the Project's Directory Structure
Tree objects in Git represent the directory structure of your project at a particular commit. Imagine a snapshot of your file system at a specific point in time. That snapshot, in Git's internal representation, is a tree object. A tree object can contain other tree objects (representing subdirectories) and blob objects (representing files). Essentially, it’s like a directory in your operating system, but within Git's object database. Tree objects are crucial because they define the hierarchical organization of your project's files at each commit.
When you make a commit, Git doesn't store copies of all your files. Instead, it creates a tree object representing the current directory structure. This tree object references blob objects for the file contents and other tree objects for subdirectories. This efficient approach avoids redundancy and saves space. By traversing the tree objects associated with a commit, Git can reconstruct the exact state of your project's directory structure and files at that commit. Therefore, tree objects are the structural backbone that allows Git to manage and track the evolution of your project's file organization over time.
Blob Objects: Storing the Content of Your Files
Blob objects, short for Binary Large Objects, are where Git stores the actual content of your files. Every file in your repository, at every version, is stored as a blob object. Think of a blob object as a raw, compressed snapshot of a file's data. Git is content-addressable, meaning that blob objects are uniquely identified by the SHA-1 hash of their content. If the content of a file remains unchanged between commits, Git reuses the existing blob object, further contributing to its efficiency and storage optimization.
Blob objects are fundamental to Git's ability to track changes. When you modify a file and commit the changes, Git doesn't store the entire file again if only a small portion has changed. Instead, it might create a new blob object for the modified content and update the tree objects accordingly.
Because blobs are content-addressed, Git can quickly determine if a file's content has changed by simply comparing hashes. This mechanism is key to Git's speed and its ability to efficiently manage large projects with extensive histories. Blob objects are the containers holding the essence of your project – the code, text, and data that constitute your work.
How Git Connects Objects to Form the DAG
Git connects commit, tree, and blob objects to form the Directed Acyclic Graph (DAG) through a system of pointers and relationships. Commit objects are the central nodes, and each commit object points to a tree object representing the project's directory structure at that commit. The tree object, in turn, points to blob objects for file contents and potentially other tree objects for subdirectories. Crucially, commit objects also point to their parent commit(s), establishing the historical lineage and directionality of the graph.
This interconnectedness is what creates the DAG. Starting from the latest commit (or HEAD), you can traverse backwards through the parent pointers to explore the project's history. The "directed" aspect of the DAG comes from these parent pointers, which always point backwards in time. The "acyclic" nature means there are no loops in the graph; you can't follow the parent pointers and return to a commit you've already visited. This structure ensures a clear and unambiguous history. Branching and merging in Git simply create new commits that diverge or converge in this graph, visually representing parallel lines of development and their eventual integration. The object model and the DAG are thus intrinsically linked, with the objects providing the data and the DAG providing the structure and history visualization.
Tools for Visualizing Git Project History
Command-Line Tools for DAG Visualization: git log --graph
The command line offers powerful tools for visualizing Git project history, and git log --graph is a prime example. This command augments the standard git log output with a textual representation of the commit graph directly in your terminal. When you run git log --graph, Git displays an ASCII art representation of the DAG alongside the commit messages, author details, and timestamps. This visualization uses characters like *, |, /, and \ to depict branches, merges, and the linear flow of commits.
git log --graph is particularly useful for quickly understanding the branching and merging history of a repository without leaving the command line. It provides an immediate, albeit textual, overview of the DAG. While it may not be as visually rich as graphical tools, its speed and accessibility within the terminal make it a valuable tool for developers who prefer working directly in the command line. For instance, simply typing git log --graph --oneline --decorate --all in your terminal provides a concise and decorated graph of your entire repository history.
Customizing git log --graph for Enhanced Visualization
The basic git log --graph command is just the starting point. You can significantly enhance its visualization capabilities through various options. For instance, the --oneline option condenses each commit to a single line, making the graph more compact and easier to scan for high-level structure. Adding --decorate displays branch and tag names, making it clear where branches diverge and converge. The --all option ensures that all branches are included in the graph, not just the current branch's history.
Furthermore, you can control the level of detail displayed in the log messages. Options like --abbrev-commit shorten commit hashes, and --date=<format> customize date formatting. Combining these options allows you to tailor the output of git log --graph to your specific needs. For example, git log --graph --oneline --decorate --all --abbrev-commit --date=short provides a highly condensed and informative graph, showing the essential structure of your repository's history in a clear, terminal-friendly format. Experimenting with these options will reveal the versatility of git log --graph for visualizing Git project history.
Graphical Git Clients: A Visual Approach to History Exploration
For a more visually intuitive approach to visualizing Git project history, graphical Git clients (GUIs) offer a significant advantage. These clients provide a rich, interactive graphical representation of the DAG, often making complex histories much easier to understand at a glance. Instead of ASCII art in the terminal, GUIs typically use visual elements like nodes, lines, and colors to represent commits, branches, and merges. This visual clarity can be especially beneficial for developers who are new to Git or working with intricate repository histories.
Graphical Git clients often go beyond simple visualization. They typically offer interactive features, such as the ability to click on commits to view details, filter commits by author or date, and visually compare different branches or commits. This interactivity allows for a deeper and more exploratory approach to understanding project history. For tasks like debugging complex merge scenarios or understanding the evolution of a particular feature branch, a graphical client can be far more efficient than relying solely on command-line tools.
Popular Git GUI Clients for Visualizing the DAG
Several popular Git GUI clients excel at visualizing the DAG, each with its own strengths and features. GitKraken is a cross-platform client known for its visually appealing and intuitive interface. It offers a clear and interactive DAG visualization, making it easy to navigate complex histories. SourceTree, another popular free option, provides a robust and feature-rich interface for managing Git repositories, including excellent DAG visualization capabilities. Fork is a macOS and Windows client praised for its speed and clean design, offering a streamlined approach to visualizing and interacting with Git history.
Beyond these, many other clients like SmartGit, Tower, and even IDE integrations like those in Visual Studio Code, IntelliJ IDEA, and Sublime Merge offer powerful Git history visualization features. Each of these clients presents the DAG in slightly different ways, but they all share the common goal of providing a more visual and understandable representation of your project's history compared to command-line outputs. Choosing the right GUI client often comes down to personal preference and the specific features that best suit your workflow.
Benefits of Using GUI Clients for Visualizing Project History
The benefits of using GUI clients for visualizing Git project history are numerous. Firstly, enhanced visual clarity is paramount. GUIs transform the often-dense textual output of command-line tools into a visually digestible format, making it easier to grasp the overall structure and flow of your project's history. Secondly, interactive exploration is a key advantage. GUIs allow you to click, drag, and zoom through the history graph, investigate commit details with ease, and visually compare branches, significantly enhancing the exploratory process.
Furthermore, GUIs often provide advanced filtering and searching capabilities, allowing you to quickly narrow down the history to specific commits, authors, or timeframes. They can also offer features like visual merge conflict resolution, making complex merge scenarios easier to manage. For developers who prefer a more visual and interactive workflow, or for teams onboarding new members who need to quickly understand project history, GUI clients offer a compelling and efficient way to visualize and navigate the Git DAG.
Interpreting the Git DAG: Branching, Merging, and Rebasing
Visualizing Branches in the History Graph
Branches in Git are visually represented as diverging lines in the DAG. When you create a new branch, it essentially creates a new pointer to a commit, and subsequent commits on that branch extend a new line of development diverging from the main line or another branch. In visualization tools, branches are often depicted using different colors or labels, making it easy to distinguish between parallel lines of development. The point where a branch diverges from another is visually marked as the point where the new line originates.
Visualizing branches in the DAG helps developers understand the branching strategy employed in a project. You can clearly see when feature branches were created, how long they lived, and when they were merged back into the main branch or other branches.
This visual representation is invaluable for understanding the concurrent development efforts within a project and how different features or fixes were developed in isolation before being integrated. For example, in a typical feature branch workflow, you would see branches diverging from the main branch, representing feature development, and then converging back into the main branch upon completion of the feature.
Understanding Merge Commits and Their Impact on the DAG
Merge commits are crucial for integrating changes from one branch into another, and their visual representation in the DAG is distinctive. A merge commit is a commit with two (or more) parents, representing the point where two or more branches were combined. In the DAG, merge commits are typically depicted as nodes where lines from different branches converge. The merge commit itself represents the result of combining the changes from its parent branches.
Understanding merge commits in the DAG is essential for comprehending how different lines of development were integrated. They visually mark the points of integration in the project's history. Analyzing the merge commits can reveal the flow of features from development branches into integration branches like main or develop. Furthermore, visualizing merge commits can help identify potential merge conflicts or complex integration scenarios, as these often result in more intricate patterns around the merge commit nodes in the DAG. For example, a three-way merge, which occurs when there are divergent changes in both branches being merged and their common ancestor, will be visually represented with a merge commit node clearly linking the two branches being merged and their common ancestor path.
Rebase Operations and Their Effect on the Project's History
Rebase operations alter the Git history by rewriting it. Visualizing the DAG before and after a rebase clearly demonstrates its impact. Rebasing essentially replants a branch onto a new base commit. In the DAG, this is visualized as if the branch was originally created from the new base commit, effectively linearizing the history. Commits from the rebased branch appear to be directly following the new base commit, rather than diverging and then merging as they would with a merge commit.
The visual effect of rebasing on the DAG is significant. It transforms a potentially branching and merging history into a more linear one. While rebasing can create a cleaner, easier-to-follow history, it's crucial to understand that it rewrites history. This means that commits that existed before the rebase are replaced with new commits with different commit hashes, even if the changes are the same. Visualizing the DAG after a rebase will show a more linear path, but it's important to remember that the historical record has been altered. For instance, rebasing a feature branch onto the main branch before merging will result in the feature branch's commits appearing as if they were directly added to main in a linear sequence, rather than as a merge from a separate branch.
Identifying and Resolving Complex History Scenarios through Visualization
Visualizing the Git DAG is invaluable for identifying and resolving complex history scenarios, such as intricate merge conflicts or accidental branch divergences. When faced with a complex history, a textual log can be overwhelming. However, a visual representation of the DAG can often reveal patterns and relationships that are difficult to discern from text alone. For instance, a complex merge conflict might be visualized as intertwined branches converging in a tangled manner, highlighting the point of contention.
By visualizing the DAG, developers can more easily pinpoint the source of problems in the history. They can trace back the path of changes, identify where branches diverged unexpectedly, or understand the sequence of merges that led to a particular state.
Furthermore, visualization tools often provide features to compare different versions of files or branches visually, aiding in the resolution of merge conflicts. For example, if a bug is introduced after a complex merge, visualizing the DAG around the merge commit can help identify the branches and changes that might have contributed to the issue, making debugging and resolution more efficient.
Advanced Techniques for Analyzing the Git DAG
Using gitk for Interactive History Exploration
gitk is a powerful, built-in Git history browser that provides an interactive graphical view of the DAG. Unlike basic git log --graph, gitk is a fully graphical application, offering a more feature-rich environment for exploring project history. When launched, gitk displays a window with two main panes: a visual DAG representation on top and a commit details pane below. The DAG visualization is interactive; you can click on commits to view their details, branches, and associated changes.
gitk excels at allowing interactive exploration of the DAG. You can easily navigate through commit history, follow branches, and inspect the differences introduced by each commit. It supports filtering commits by author, date, or commit message, making it easier to focus on specific parts of the history. Furthermore, gitk allows you to visually compare different branches or commits, highlighting the changes between them. For developers who need a more in-depth, interactive exploration of the DAG than command-line tools provide, gitk is a valuable and readily available option.
Scripting Git Commands for Custom History Analysis
For highly customized analysis of the Git DAG, scripting Git commands offers unparalleled flexibility. Git commands can be combined and scripted in languages like Bash, Python, or Ruby to extract specific information from the DAG and process it according to custom needs. For example, you can write scripts to analyze branch lengths, identify commits without specific keywords in their messages, or generate reports on commit frequency over time.
Scripting allows you to go beyond the built-in visualization tools and create tailored analyses of your project's history. You can use commands like git log --pretty=format:... to extract commit data in a structured format, then process this data using scripting languages to generate custom visualizations or reports. This approach is particularly useful for automating history analysis, integrating Git history data into other tools, or performing complex queries on the DAG that are not easily achievable with standard Git commands or GUI clients. For instance, a script could be written to visualize the contribution of each developer to different parts of the codebase over time, offering insights into team dynamics and code ownership.
TUI Visualization Tools
Beyond command-line tools and full GUI clients, Text-based User Interface (TUI) visualization tools offer a middle ground for exploring the Git DAG. These tools run within the terminal but provide a more interactive and visually structured interface than simple command-line outputs. Examples of TUI Git clients include tools like tig (Text-mode interface for Git) and some terminal-based modes in more comprehensive development tools.
TUI visualization tools often provide a navigable DAG view within the terminal, allowing you to scroll through commit history, view commit details, and sometimes even perform basic Git operations directly from the TUI. They offer a balance between the speed and accessibility of command-line tools and the visual clarity of GUI clients. For developers who spend a significant amount of time in the terminal but desire a more structured and visual way to explore Git history than git log --graph, TUI tools can be a practical and efficient option. They can be particularly useful in remote server environments where graphical interfaces might be less readily available or less performant.
Best Practices for Maintaining a Clean and Understandable Git History
Committing Frequently and with Clear Messages
Committing frequently and writing clear, concise commit messages are fundamental best practices for maintaining a clean and understandable Git history. Small, frequent commits make it easier to track changes, revert to previous states, and understand the evolution of the codebase. Each commit should represent a logical unit of change, focusing on a single feature, bug fix, or refactoring task. This granularity makes the history more navigable and easier to review.
Clear commit messages are equally crucial. A well-written commit message should concisely explain why the changes were made, not just what was changed. Following established conventions, such as using imperative mood and summarizing the change in the first line, improves readability and consistency across the project history.
Combined, frequent commits with descriptive messages create a Git history that acts as a valuable documentation of the project's development process, making it easier for both current and future developers to understand the codebase and its evolution. For example, instead of a commit message like "Fixed bug," a better message would be "Fix: Resolve issue with user authentication failing after password reset," clearly stating the fix and its context.
Using Branching Strategies for Feature Development
Employing well-defined branching strategies for feature development is essential for maintaining a clean and manageable Git history, especially in collaborative projects. Strategies like Gitflow or GitHub Flow provide structured approaches to branching, ensuring that development work is isolated in feature branches, integrated through merge requests or pull requests, and that the main branch remains stable. These strategies promote parallel development, reduce the risk of introducing regressions into the main codebase, and create a clearer, more organized DAG.
By using feature branches, each new feature or significant change is developed in isolation, preventing interference with ongoing work on other features or the main branch. Merging feature branches back into the main branch (or a development branch) via merge requests or pull requests provides an opportunity for code review and discussion before integration, further enhancing code quality and history clarity. Branching strategies, when visualized in the DAG, result in a history that clearly separates feature development from the main line, making it easier to understand the development process and track the introduction of new features.
Avoiding Large or Unnecessary Commits
Large commits, encompassing numerous unrelated changes, and unnecessary commits, such as those made for minor formatting adjustments without functional changes, can clutter the Git history and make it harder to understand. Large commits make it difficult to isolate the purpose of changes and increase the risk of introducing regressions. Unnecessary commits add noise to the history, obscuring the meaningful changes and making it harder to navigate and review.
Best practice is to break down large changes into smaller, logical commits, each focused on a specific, well-defined task. Formatting changes or minor code style adjustments should ideally be separated from functional changes or addressed automatically by linters and formatters. Avoiding large and unnecessary commits results in a cleaner, more focused Git history, where each commit represents a meaningful and easily understandable change, improving the overall clarity and maintainability of the project's version control history.
Regularly Reviewing and Cleaning Up Git History
While rewriting history should be done with caution, regularly reviewing and occasionally cleaning up Git history, when appropriate, can contribute to its long-term clarity and maintainability. This doesn't necessarily mean rewriting public history, but rather focusing on cleaning up local or feature branch histories before merging or sharing them widely. Techniques like interactive rebasing can be used to reorder, squash, or edit commits within a branch to create a more linear and logical history before merging.
Reviewing history also involves ensuring commit messages are clear and consistent and that the overall structure of the DAG reflects the project's development process accurately. For example, before merging a feature branch, developers might use interactive rebase to squash multiple small commits into a single, more comprehensive commit, or to reword commit messages for better clarity. This proactive approach to history maintenance, performed judiciously and with awareness of the potential risks of rewriting history, can contribute to a cleaner, more understandable, and ultimately more valuable Git history for the project's lifetime.
Practical Examples of Visualizing Git Project History
Case Study: Debugging a Bug Using the History Graph
Imagine a bug has been reported in the latest release of your software. To effectively debug this issue, visualizing the Git history can be invaluable. Using a GUI client or git log --graph, you can examine the recent commits leading up to the release, focusing on changes made in the relevant files or modules. By visualizing the DAG, you can quickly identify potential suspect commits – those that introduced significant changes or merged in feature branches that might be related to the bug.
For example, if the bug is related to user authentication, you might focus on commits that modified authentication-related files. By examining the commit details and diffs in the visualization tool, you can pinpoint the exact changes introduced in each commit. Tracing back through the history graph, you can identify the commit that likely introduced the bug. This process of visual debugging, using the history graph to narrow down the search space, is often significantly faster and more efficient than blindly stepping through code or relying solely on textual logs.
Scenario: Understanding the Impact of a Rebase on Multiple Branches
Consider a scenario where a rebase operation has been performed on a feature branch that was shared with a colleague. Visualizing the Git history after the rebase is crucial for understanding its impact, especially if your colleague was working concurrently on the same branch. Before the rebase, the DAG would show the feature branch diverging from a common ancestor and potentially merging with other branches if there were prior integrations. After the rebase, the visualization would show the feature branch seemingly "transplanted" onto a new base, with new commit hashes for the rebased commits.
Visualizing the DAG in this scenario immediately highlights the change in the branch's base and the rewriting of history. It allows you to explain to your colleague that the branch history has been altered and that they might need to re-synchronize their local branch with the rebased remote branch. Understanding the visual impact of rebasing on the DAG is essential for communicating these changes effectively within a team and avoiding potential confusion or conflicts arising from history rewriting.
Example: Tracing the Evolution of a Specific File Through the DAG
Suppose you want to understand how a particular file in your project has evolved over time – perhaps you need to know when specific lines of code were added or modified. Visualizing the Git DAG, combined with file history tools, makes this task straightforward. Using git log --graph -- <file_path> you can view the history graph specifically related to changes in that file. This command will show only the commits that modified the specified file, along with their relationships in the DAG.
Alternatively, GUI clients often provide features to view the "file history" or "blame" for a specific file. These features visually present the commit history relevant to the file, highlighting when each line of code was last modified and by which commit. By tracing the file's evolution through the DAG, you can understand the context of changes, identify when specific features were introduced or bugs were fixed in that file, and gain valuable insights into its development trajectory. This detailed file history visualization is invaluable for code archaeology and understanding the rationale behind specific code segments.
Conclusion: Mastering Git Through Visualizing Your Project's History
Mastering Git is not just about memorizing commands; it's about understanding the underlying concepts, and visualizing your project's history graph—the DAG—is key to this deeper understanding. By embracing the power of visualization, developers can unlock a more intuitive and efficient way to navigate, debug, and collaborate on projects managed with Git. From understanding branching strategies to resolving complex merge scenarios, the DAG provides a visual map that clarifies the often-intricate landscape of version control.
Visualizing Git project history transforms the abstract concept of version control into a tangible and understandable representation. Whether you prefer command-line tools like git log --graph or graphical clients with rich interactive features, the ability to see your project's history graph is an indispensable skill. By making visualization a core part of your Git workflow, you enhance your ability to manage complexity, collaborate effectively, and ultimately master the power of Git for more productive and successful software development.
Frequently Asked Questions
How does visualizing Git project history benefit developers?
Visualizing Git project history helps developers understand complex branching and merging, identify potential issues more easily, and track the evolution of the project over time.
What is a DAG in the context of Git, and why is it important?
DAG stands for Directed Acyclic Graph, which represents the commit history. Understanding the DAG allows developers to comprehend the relationships between commits and branches, crucial for effective collaboration and debugging.
What are some tools or techniques for visualizing Git project history?
Tools like git log --graph, Git GUIs (e.g., GitKraken, SourceTree), and web-based platforms like GitHub and GitLab offer visual representations of the commit graph. These aids help developers grasp the overall project structure and individual changes.
How can visualizing Git history help with debugging and resolving conflicts?
By seeing the branching and merging points visually, developers can pinpoint where conflicts arose. This makes it easier to understand the context of the changes and resolve conflicts more efficiently.
Reflogs, which track changes to refs (branches and tags), provide a detailed history of branch movements. Visualizing reflogs can help recover lost commits or branches and understand how the Git repository has evolved, even with destructive actions.
Final Reflection: Embracing the Flow of Time
The journey through Git's Directed Acyclic Graph (DAG) reveals more than just code history; it unveils the collaborative narrative of software development. Understanding how to visualize this history isn't merely a technical skill; it's a crucial tool for navigating the complexities of modern projects, fostering clarity, and empowering teams to learn from the past.
The ability to see the branching paths, merges, and individual contributions within a Git repository profoundly impacts how we understand the evolution of our work. This understanding fosters a deeper appreciation for the iterative nature of software creation and the interconnectedness of individual efforts. Those who cannot remember the past are condemned to repeat it.
- George Santayana. By visualizing our Git history, we are actively choosing to learn from our past mistakes and build upon our successes.
Now, armed with the knowledge of visualizing Git project history, I invite you to reflect on your own projects. How can a clearer understanding of your project's DAG improve your workflow, enhance collaboration, and ultimately, lead to better software? Embrace the power of visualization, and unlock the hidden stories within your code.
Visualize & Conquer: Map Your Git Journey!
Thanks for exploring Git's Directed Acyclic Graph (DAG) with us! We hope you've gained a clearer understanding of how Git meticulously tracks your project's history. Now, it's time to apply that knowledge.
Here's how you can solidify your understanding and further explore Git's powerful history tracking:
- Start visualizing! Use a Git GUI tool or command-line options like
git log --graph --oneline --decorateto actively explore the DAG of your projects. Understanding the visual representation will greatly enhance your ability to navigate complex histories. - Dig deeper: Experiment with different Git commands that alter the DAG, such as
rebaseormerge. Carefully observe the resulting graph changes to truly grasp their impact. Remember to do this on a branch, not the main branch! - Share Your Insights: Discovered a particularly fascinating branch or commit history? Share a screenshot of your project's DAG on social media using #GitDAG to spark a discussion!
What's the most interesting branch you've uncovered in your project's history, and what did you learn from its unique path?